 Footballscience.net

Chapter 8 was about the UEFA clubs and their revenue.
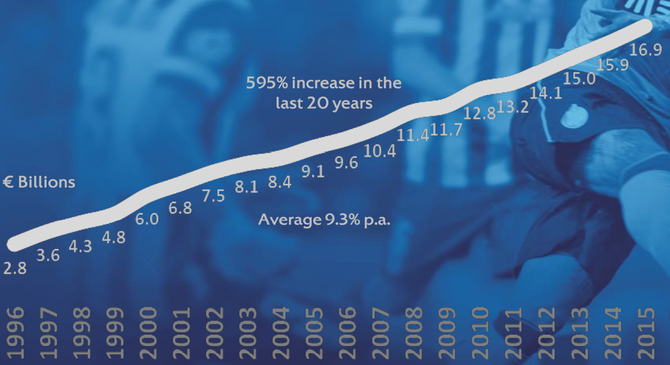
Generally, revenue has grown over the last year with an average of more than 9% per year. The club’s revenue are now six times the level of 1996.
Interestingly, the average English Premier League club having five times more revenue than the average Italian Serie A or French Ligue 1 club.
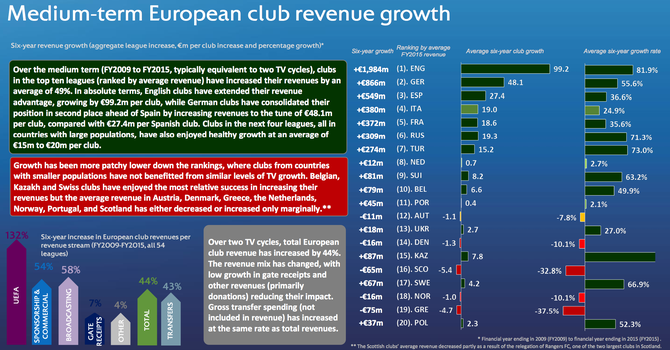
The average six-year club growth was the greatest in England followed by Germany, Spain and Italy. On average, every club in England extended its revenue by 99.2 mio Euros, followed by German
clubs (48.1), Spanish club (27.4) and Italy (19.0).
So how much do the clubs earn on average?
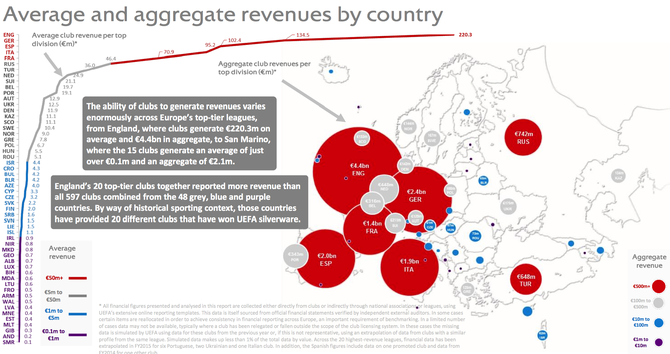
According to UEFA, the ability of clubs to generate revenue varies enormously. For example a club in England generate ~220 mio, followed by Germany ~135 mio, Spain wit ~102 and Italy ~95 mio
Euros.
As a consequence its not surprising that England aggregated 4.4 bn in its top division, followed by Germany (2.4 bn), Spain (2.0 bn), Italy (1.9 bn) and France (1.4 bn). In 2015 there were 46
clubs with an annual revenue of 100+ mio Euros.
The map shows where the wealth in football is concentrated.
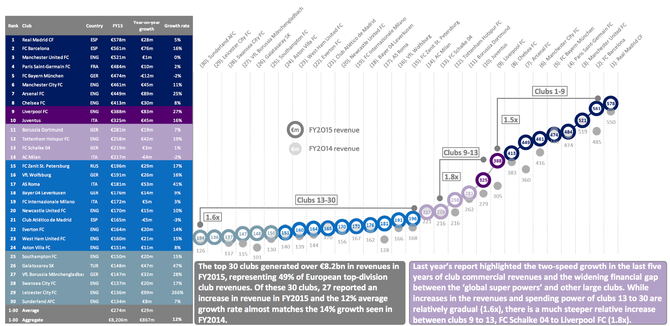
So what are the top clubs in terms of total revenue in 2015?
The greatest revenue was generated by Real Madrid (578 mio), followed by Barcelona (561 mio) and ManU (521 mio). Juventus as the first Italian club ranked 10th with 325 mio Euros. Zenit
Petersburg comes in with 196 mio at 15th place and Galatasaray with 148 mio at rank 26.
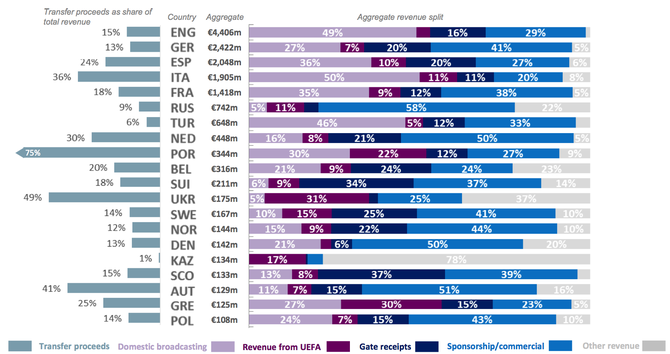
The club’s revenue come from diverse income streams. Number one is domestic broadcasting (34%), followed by Sponsorships (24%), Gate receipts (16%), revenues from UEFA and commercials (both 9%)
and other revenues (8%).
The picture below shows broadcast revenues for the six largest domestic leagues. Obviously, the broadcast revenues in England exceeded 100 mio per club, comfortably more than double the Italian
and triple the Spanish and German average. Interestingly, the 36.1 mio per club in Germany displays 27% “only” of the total revenue, while 47.7 mio equals 50% of the total revenue in Italy.
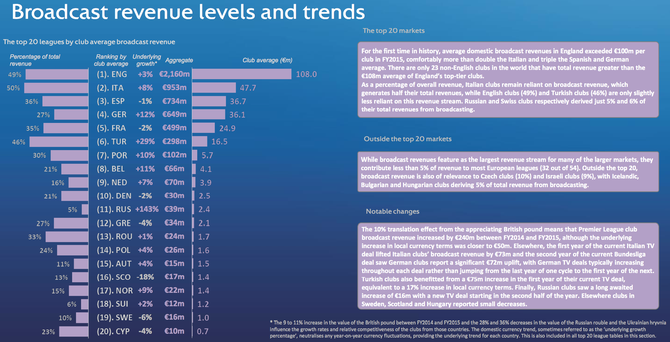
While 17 out of the 20 top clubs by broadcast revenues are from England, the top two are Barca and Real Madrid from Spain. Both clubs receiving 3.8 – 3.9 times the league average (equaling ~142 mio Euros).
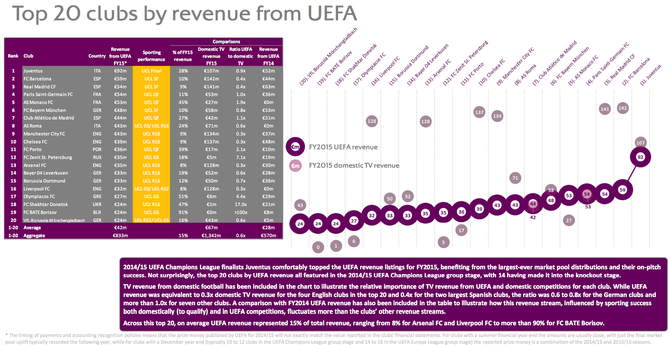
Another income source was the UEFA price money, which is determined in part by the clubs sporting performance. While the UEFA price money equals ~51% of the clubs revenue in Bulgaria (10th
place), its about 4% (in England) and 10% (in Spain) leading to a club average of 10.5 mio Euros.
The top 20 clubs receiving from UEFA can be seen in the slide below.
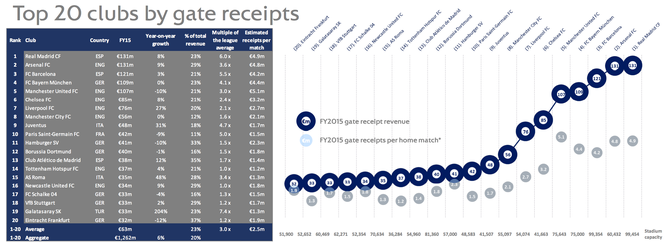
Gate receipts as the third highest income stream for clubs in different countries are as follows in the next slide.
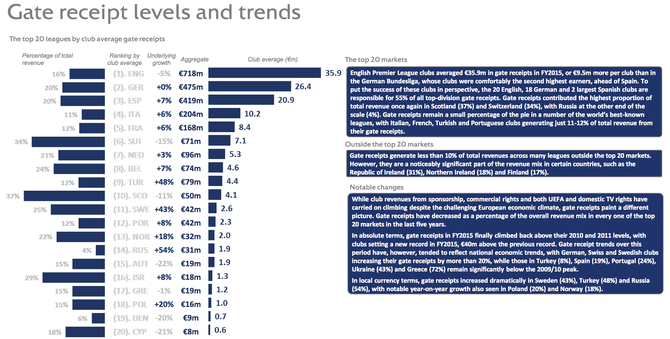
Real Madrid receives the greatest amount (compared to other clubs) from gate receipts having 4.9 mio per match which is about six times the Spanish league average. There seemed to big differences in the ability to generate revenue from gate receipts. Five clubs, all with 60.000+ stadium capacities generated more than 100 mio Euros with an average per home game between 4.2 and 5.1, however, Juventus in 5th place generating only half of that.
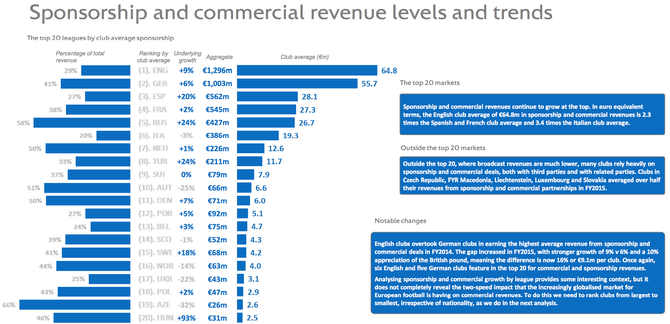
Sponsorship, as the second biggest income stream provided at least 20% (19.3 mio in Italy), but not more than 66% (2.6 mio in Azerbaijan) of the total revenue. The highest club average of 64.8 mio was received in England.
The last part of the UEFA club revenue highlights was about transfer proceeds. Sorted after the total amount of transfer proceeds, Real Madrid sat in front with 111 mio Euros, however, spending 186 mio which ends-up in a total of net transfer proceeds of -75 mio. Genoa CFC was the club that created the greatest net transfer proceeds with 68 mio Euros. However, having a closer look on the original transfer costs and the achieved revenue, FC Porto created the highest profit with 49 mio Euros.

Three English clubs ManCity, ManU and Chelsea have to be named as the top clubs selling players for “marked-down”, with -95, -74 and -42 mio Euros respectively. Interestingly, there are no
“country” trend for this part, meaning that we will find clubs of different countries (England, Portugal, France, Italy, Germany, Spain, Ukrain) inside the top 20 of club transfer proceeds.
Interestingly, ManU spend 198 mio in transfers resulting in a net transfer proceed of -144 mio. The top 20 clubs aggregated a net transfer proceed of -341 mio Euros.
The last two slides is about the revenue mix in (and outside) the top 20 leagues sorted after aggregate revenue. Clubs in Italy and England (on average) depend on domestic broadcasting with an
average of 50 and 49%. However, transfer proceeds made up of 75% of the clubs revenue in Portugal.
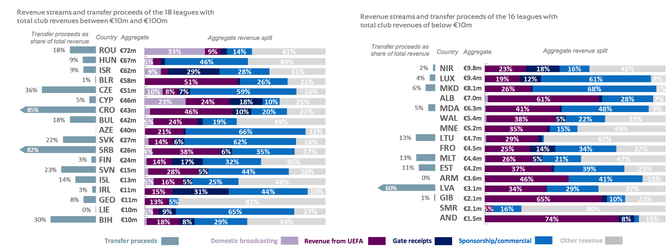
Revenue mix outside the Top 20 leagues showed that transfer proceeds (relative to revenue) were the highest in Croatian (85%) and Serbian clubs (82%). Revenue from UEFA club competition is highly significant for clubs in most middle-income and lower-earning leagues.
Reference
http://www.uefa.org/MultimediaFiles/Download/Tech/uefaorg/General/02/42/27/91/2422791_DOWNLOAD.pdf
